Book an Enapps demonstration!
Complete our enquiry form and we'll get back to you to arrange your free demonstration either on-site or in our London office


The Enapps Business Intelligence Software ERP module consists of a number of visual tools which enhance the operators use of the ERP system by providing visual data pointers to the most important metrics for their particular discipline. System dashboards can be built using graphs, Kanban’s, Gantt charts, maps and KPIs. The Enapps numerical callout functionality also helps within this area by designating a numerical value against a saved system favourite. All of this functionality comes together to deliver a mixture of relevant data visuals which can be user configured for any job function.

Enapps ERP comes as standard with a powerful KPI module that can accommodate any mixture of system metrics. This module does not only capture sales data, but can also for instance capture information from the warehouse operatives which can be key for operational metrics and compliance. Enapps use the built-in KPI functionality to deliver a full picture of warehouse operative efficiencies with a view to calculating the true costs associated with any product.
The Enapps dashboarding system allows the operator to create custom or shared dashboards across each discipline within the company. Multiple user configurable dashboards for each operator are supported as standard, and they can contain most elements of the system such as list views, graphs, maps, KPIs and Kanban’s. Also note that Enapps dashboards are not just graphical representations of the data, but can also be directly ‘drilled’ into, to get the precise information that is required.
Where necessary, Enapps integrates with ‘best of breed’ third-party software to enhance our offering. Phocas is ranked #1 BI solution in Gartner’s FrontRunners Report 2021 and offers seamless adaptive, ad-hoc reporting and analysis. This integration enables an SME business to introduce advanced reporting and forecasting with instant, focused and visual data on demand.
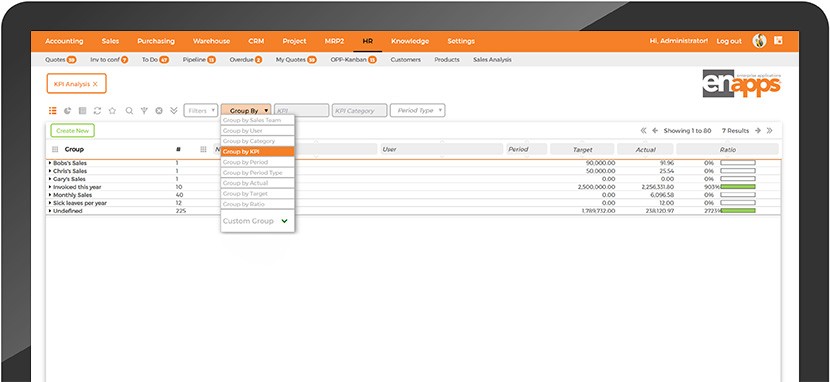
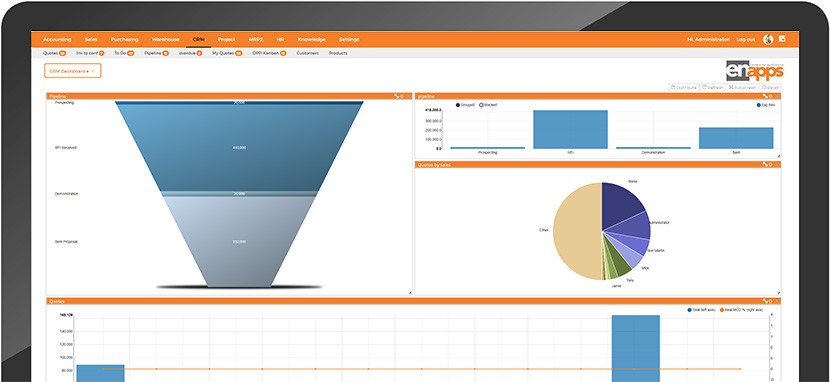
List views within the system can be viewed via the Enapps system built-in visuals such as Bar, Funnel or Map.
Create and share multiple custom dashboards which can be operator built for each discipline.
Create a system favourite which has a real time numerical value attached to it such as the number of outstanding ToDo items.
Create instant on-screen reports filtered by any number of dimensions.
Use in-system ERP data to create a real-time pivot table similar to Excel.
If required, link to an external BI tool provider to maintain your current BI reporting look and feel.
Book an Enapps demonstration!
Complete our enquiry form and we'll get back to you to arrange your free demonstration either on-site or in our London office